Snowflake Connector: How to Connect to Your Data Warehouse
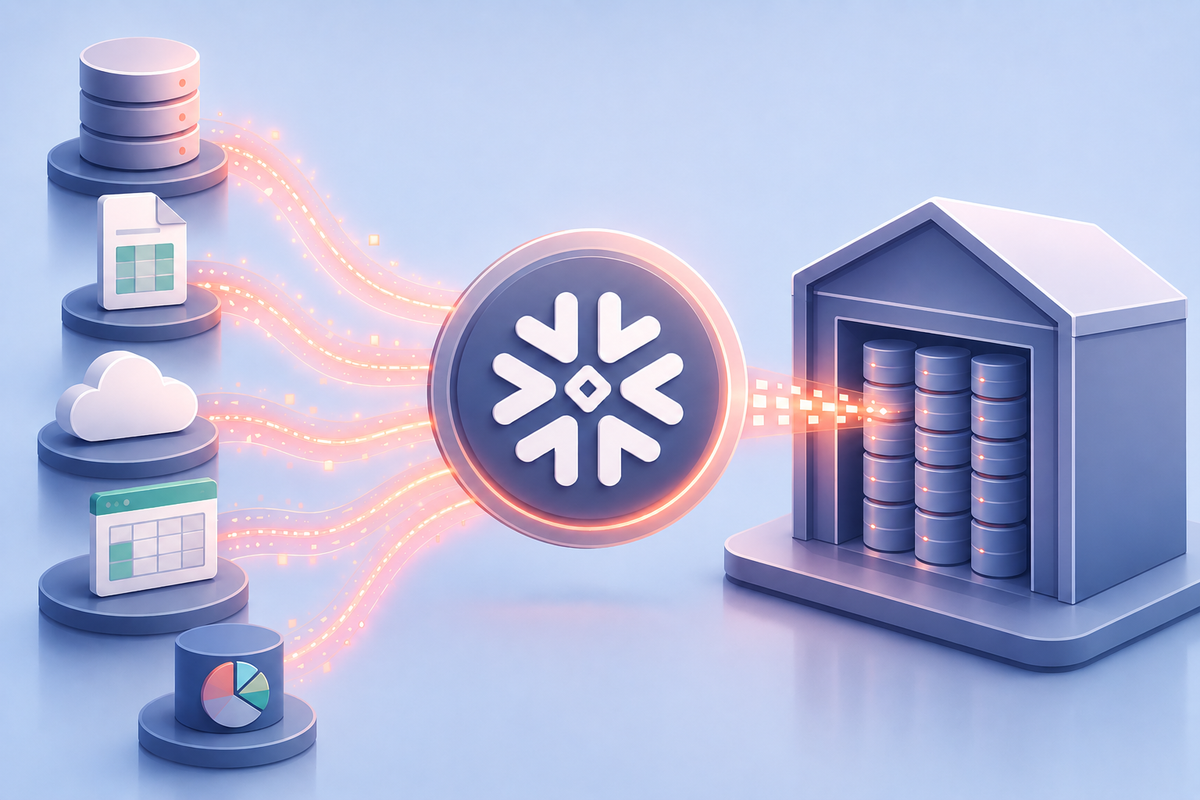
If your organization uses Snowflake to store data, a Snowflake connector is the link between your data warehouse and the tools your team uses every day. Think of it as a bridge. Your data lives in Snowflake, and the connector is what lets your reporting platform, your analytics tool, or your automation workflow pull that data on demand, without anyone having to manually export a file or copy numbers into a spreadsheet. For analysts who spend time every week gathering data before they can even start their actual work, a well-configured Snowflake connection can be the difference between reporting that runs itself and reporting that takes two days to prepare.
What a Snowflake Connector Actually Does
When you set up a Snowflake connector, you are essentially giving your analytics platform permission to access your data warehouse and pull the data your workflows need. You enter your Snowflake account credentials, choose which databases and tables are relevant, and the connection handles the rest. From that point on, your platform can query Snowflake automatically, on a schedule you define, without anyone having to log in, run a manual export, or move a file. The data flows directly into your reports, dashboards, or pipelines as if it were always there.
The best Snowflake connectors are designed so that analysts, not just engineers, can set them up and use them. You should be able to browse your available data, select what you need, and start building a workflow without writing any code. Once the connection is running, it should stay running: refreshing on schedule, picking up new data automatically, and alerting you if something looks off. For a business analyst who needs reliable, up-to-date data every Monday morning, that reliability is just as important as the connection itself.
What Analytics Teams Actually Need From a Snowflake Integration
The analysts who feel this most acutely are the ones sitting between the data warehouse and the business. They know their way around Excel and their reporting tools, and they understand the data well enough to build and maintain recurring reports, but they do not have a dedicated engineering team standing by to build automated pipelines for them. Their job is to produce accurate, timely reporting, often for external clients or senior stakeholders, and the pressure to deliver is high. What they need from a Snowflake integration is not just access to the data. They need a platform that can pull from Snowflake and every other source their workflows touch, apply the business logic their reports require, and produce outputs in the formats their teams and clients actually use.
This is a pattern that shows up consistently across marketing, finance, and research and insights teams. A marketing analytics team might pull campaign performance data from Snowflake, cross-reference it with spend data from Google Ads and LinkedIn, apply attribution logic that has been defined in a shared spreadsheet for years, and deliver a formatted Excel or PowerPoint report to a client every Monday. Each step in that workflow is manual, each step introduces the possibility of error, and the whole thing has to be rebuilt from scratch when someone goes on vacation or leaves the team. The Snowflake connector is the entry point. The automation platform is what makes that entire workflow reliable and repeatable.
What This Looks Like in Practice
Consider a research and insights team at a large media company. They maintain dozens of recurring reports that pull data from Snowflake, where their audience and behavioral data lives, alongside inputs from Nielsen, internal CRM systems, and a handful of campaign platforms. Each week, analysts spend the better part of two days collecting and preparing that data, running it through a set of custom calculations, and formatting the output into PowerPoint presentations for brand clients. The work is not complex in the sense of requiring advanced data science. It is complex in the sense of being tedious, error-prone, and almost entirely manual.
When a team like this adds a proper automation layer on top of their Snowflake connector, the workflow changes fundamentally. The data collection runs automatically on a schedule. The harmonization logic, the joins, the deduplication, the metric calculations, is encoded once and applied consistently every time. The reporting agent formats the output directly into the PowerPoint template the client expects, applying branding standards and layout specifications without anyone touching a slide. The analyst who used to spend Tuesday and Wednesday preparing data now spends that time reviewing the output, adding interpretation, and thinking about what the numbers mean. That shift, from data preparation to data analysis, is where the value of a well-integrated Snowflake connection actually lives.
What to Look for in a Snowflake Connector
When evaluating a Snowflake connector or the platform it is part of, the first question to ask is whether it works with Snowflake alone or alongside every other data source your team relies on. Most reporting workflows pull from more than one place. You might have performance data in Snowflake, spend data in Google Ads, audience data in a CRM, and campaign data in Facebook, all of which need to come together in a single report. A connector that handles Snowflake but leaves the rest to manual exports has not really solved the problem. Look for a platform where Snowflake is one of many sources, not the only one.
The second question is what the platform does with the data after it pulls it. Getting data out of Snowflake is the starting point, not the finish line. You want a platform that can combine your Snowflake data with other sources, apply the calculations and business logic your reports depend on, and keep that logic consistent every time the report runs, without someone having to redo it manually. The goal is a workflow where the hard work of preparing data happens once, is saved, and runs automatically going forward.
Third, think about where the data ends up. Dashboards are useful, but most business teams also need reports in Excel, slides in PowerPoint, or documents formatted for a specific client. If the platform can take your Snowflake data, apply your business logic, and drop the results directly into a formatted Excel file or PowerPoint deck, that is a very different outcome from a tool that gets you as far as a dashboard and leaves the rest to you.
Finally, consider how easy the platform is to use without technical support. A Snowflake integration that requires a data engineer every time you want to change a report or add a new data source will always be a bottleneck. The best platforms are ones where an analyst can set up and modify workflows on their own, ask questions of the data in plain language, and get answers without filing a ticket or waiting on someone else.
How Redbird Connects to Snowflake and the Rest of Your Data Ecosystem
Redbird is an AI-powered workflow automation tool that connects to Snowflake as part of a broader connectivity layer spanning cloud data warehouses, enterprise systems like SAP and Oracle, SaaS platforms including Google Analytics, Google Ads, Facebook, LinkedIn, and Campaign Manager, file-based sources, and legacy systems where no standard API exists. The Snowflake connector is one piece of a platform designed to automate the full data lifecycle: from ingestion and transformation through advanced analytics and production-ready output delivery.
When a user connects Snowflake to Redbird, they are not just enabling data access. They are bringing the warehouse into an environment where purpose-built AI agents handle every step of the workflow that follows. A Data Collection Agent pulls from Snowflake and every other configured source. A Data Engineering Agent harmonizes the data, applies transformations, and ensures the output is clean and analysis-ready. An Analyst Agent computes custom metrics and applies business logic. A Reporting Agent assembles the final deliverable in the format the team actually uses, whether that is an Excel file, a PowerPoint presentation, or a live dashboard, using existing templates and standards. All of this runs on a scheduled cadence without manual intervention, and every step of every workflow is fully auditable.
What makes this architecture meaningful in practice is that it compresses timelines that typically take hours into minutes. Teams that used to spend 60 to 80 percent of their analyst time on data preparation report dramatically less time doing that work after deploying Redbird. That time does not disappear. It moves upstream, into interpretation, strategy, and the kind of analytical work that actually requires human judgment. Redbird works with organizations across financial services, media, consumer goods, and technology, including eight of the Fortune 50, in environments where the accuracy, auditability, and scale requirements are among the most demanding in the world.
The Bottom Line
The right Snowflake connector is not just a data tap. It is the foundation of how your team gets from raw warehouse data to finished, accurate reports. It should connect to the other sources your workflows depend on, keep your data fresh on a schedule, and sit inside a platform that handles the logic, the validation, and the delivery without manual work in between. The teams that get the most out of their data warehouse investment are the ones who have built, or found, an automation layer that handles everything that happens after the data pull: the harmonization, the transformation, the calculation, and the delivery of outputs that people can actually use. If your analysts are still spending the majority of their time preparing data rather than analyzing it, the question is not whether your Snowflake connection is working. It is whether the workflow built on top of it is working as hard as it should be.