SAP Connector for Analytics: A Smarter Way to Connect and Automate
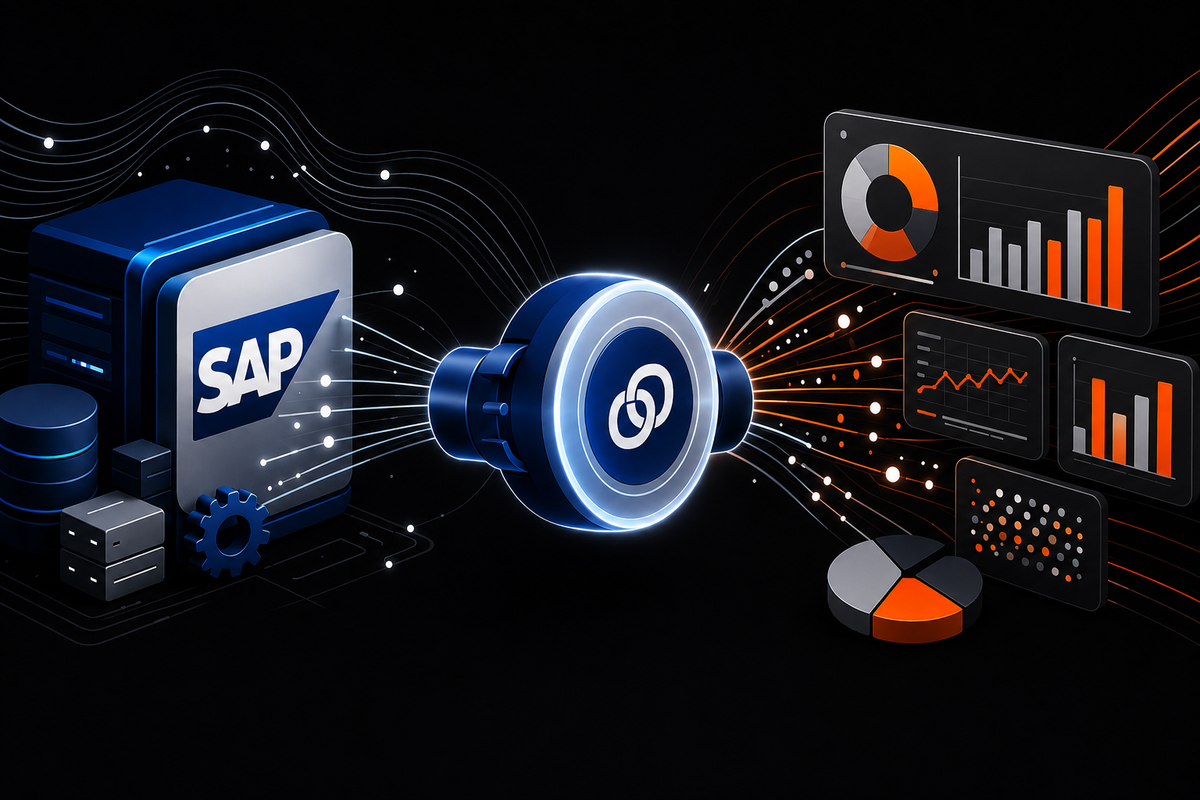
If your organization runs SAP, your most critical business data lives there. Finance records, procurement data, supply chain transactions, HR information - SAP is the system of record that the rest of the business depends on. But having data in SAP and being able to use it in your reports and workflows are two different things. An SAP connector bridges that gap. It gives your analytics platform, your reporting tools, or your automation workflows direct access to SAP data, without manual exports, middleware, or engineering tickets every time someone needs a number. For finance and operations teams who spend days preparing data before they can analyze it, a well-configured SAP connection changes what is possible.
What an SAP Connector Actually Does
When you set up an SAP connector, you are giving your analytics platform authenticated access to the tables, modules, and data objects your workflows depend on. You configure the connection credentials, specify which SAP modules and data sources are relevant (FI for finance, CO for controlling, SD for sales, MM for procurement, or others), and the connector handles the rest. From that point on, your platform can query SAP on a schedule without anyone logging into the system, running a transaction, or exporting a file to a shared drive. The data moves directly into your reports and pipelines as if it had always been there.
The best SAP connectors are built so that analysts, not just SAP BASIS consultants, can configure and use them. You should be able to browse available tables, select the fields your reports need, and start building a workflow without writing ABAP code or filing a support ticket. Once the connection is running, it should stay running: refreshing on schedule, handling incremental loads as new transactions post, and surfacing issues before they affect a deliverable. For a finance team that closes the books every month and reports to the CFO every week, that reliability is not optional.
What Analytics Teams Actually Need From an SAP Integration
The analysts who feel the pain of SAP data access most acutely are the ones sitting between the ERP and the business. They understand the data model well enough to know which tables matter and which fields to join. They can build a report in Excel that is accurate and useful. But they do not have the SAP development access or the time to build automated data pipelines, and the IT queue for new extracts is long. Their job is to produce timely, accurate reporting for finance leadership, operations teams, or external stakeholders, and every week a meaningful portion of that time goes to pulling data rather than analyzing it.
This is a pattern that shows up consistently across FP&A, supply chain, and shared services functions. A financial planning team might pull actuals from SAP FI, compare them against a budget that lives in an Excel model, apply allocation logic that has been documented in a shared workbook for years, and deliver a formatted management report every Monday morning. A procurement team might pull purchase order data from SAP MM, cross-reference it with vendor master data and contract terms, and report on compliance and savings monthly. Each step in those workflows is manual, each step introduces the possibility of error, and the whole process has to be reconstructed from scratch when a team member leaves. The SAP connector is the entry point. The automation layer on top of it is what makes the workflow reliable and repeatable.
What This Looks Like in Practice
Consider a financial reporting team at a large manufacturing company. They maintain a set of recurring reports that pull general ledger data from SAP FI, cost center data from SAP CO, and procurement spend from SAP MM, then combine those inputs with plan data from a planning tool and present results in a formatted Excel workbook distributed to regional finance leads every Monday. The data is not complex in the sense of requiring advanced modeling. The complexity is in the assembly: knowing which tables to query, how to reconcile the joins, how to apply the allocation rules, and how to format the output so it matches the template that regional teams have used for three years.
When a team like this adds a proper automation layer on top of their SAP connector, the workflow changes fundamentally. The data pulls run automatically as soon as the prior period closes. The harmonization logic - the joins across FI and CO, the allocation calculations, the variance computation against plan - is encoded once and applied consistently every cycle. The reporting agent formats the output into the Excel template the regional teams expect, including the right tab structure, the correct column headers, and the calculated commentary fields. The analyst who used to spend Monday and Tuesday pulling and formatting data now spends that time reviewing the output, writing the narrative, and thinking about what the variances mean. That shift from data preparation to data interpretation is where the value of a well-integrated SAP connection actually lives.
What to Look for in an SAP Connector
When evaluating an SAP connector or the platform it is part of, the first question to ask is whether it works with SAP alone or alongside every other data source your team relies on. Most reporting workflows in large organizations pull from more than one place. You might have actuals in SAP, plans in Anaplan or Adaptive, headcount data in Workday, and market data in a data warehouse. All of those sources need to come together in a single report. A connector that handles SAP but leaves the rest to manual exports has not actually solved the problem. Look for a platform where SAP is one of many configured sources, not the only one.
The second question is what the platform does with the data after it pulls it. Getting data out of SAP is the starting point, not the finish line. You want a platform that can combine your SAP data with other sources, apply the business logic your reports depend on, and keep that logic consistent every time the report runs without someone having to redo it manually. The goal is a workflow where the hard work of preparing data happens once, is saved, and runs automatically going forward.
Third, think about where the data ends up. Dashboards are useful, but most finance and operations teams also need reports in Excel, presentations in PowerPoint, or documents formatted for a specific internal audience. If the platform can take your SAP data, apply your business logic, and drop the results directly into a formatted Excel file or management deck, that is a very different outcome from a tool that gets you as far as a visualization layer and leaves the last mile to you.
Finally, consider how much the platform depends on SAP expertise to operate. A connector that requires an ABAP developer every time you want to add a field or change a report structure will always be a bottleneck. The best platforms are ones where an FP&A analyst or a business analyst with strong SAP knowledge can configure and modify workflows on their own, ask questions of the data in plain language, and get answers without filing a ticket or waiting on IT.
How Redbird Connects to SAP and the Rest of Your Data Ecosystem
Redbird is an agentic AI data platform that connects to SAP as part of a broader connectivity layer spanning cloud data warehouses like Snowflake and Databricks, enterprise systems including Oracle and Workday, SaaS platforms such as Salesforce, Google Analytics, and LinkedIn, file-based sources, and legacy systems where no standard API exists. The SAP connector covers ECC, S/4HANA, and BW environments, and is one piece of a platform designed to automate the full data lifecycle: from ingestion and transformation through advanced analytics and production-ready output delivery.
When a user connects SAP to Redbird, they are not just enabling data access. They are bringing the ERP into an environment where specialized AI agents handle every step of the workflow that follows. A Data Collection Agent pulls from SAP and every other configured source on the cadence the team defines. A Data Engineering Agent harmonizes the data across systems, applies transformations, and resolves the structural differences between SAP's table-level detail and the summarized formats other tools produce. An Analyst Agent applies business logic, computes custom metrics, and runs the calculations your reports depend on. A Reporting Agent assembles the final deliverable in the format the team actually uses - whether that is an Excel workbook, a PowerPoint presentation, or a live dashboard - using existing templates and standards. All of this runs on a scheduled cadence without manual intervention, and every step of every workflow is fully auditable.
What makes this architecture meaningful in practice is that it compresses timelines that typically take hours or days into minutes. Teams that used to spend 60 to 80 percent of their analyst time on data preparation report dramatically less time doing that work after deploying Redbird. That time does not disappear. It moves upstream, into interpretation, strategy, and the kind of work that actually requires human judgment. Redbird works with organizations across financial services, consumer goods, media, and technology - including eight of the Fortune 50 - in environments where the accuracy, auditability, and scale requirements are among the most demanding in the world.
The Bottom Line
The right SAP connector is not just a data tap. It is the foundation of how your team gets from raw ERP data to finished, accurate reports. It should connect to the other sources your workflows depend on, keep your data current as transactions post and periods close, and sit inside a platform that handles the logic, the validation, and the delivery without manual work in between. The organizations that get the most out of their SAP investment are the ones who have built, or found, an automation layer that handles everything that happens after the data pull: the harmonization across modules, the reconciliation with external sources, the calculations, and the delivery of outputs that finance and operations leaders can actually use. If your analysts are still spending the majority of their time preparing data rather than analyzing it, the question is not whether your SAP connection is working. It is whether the workflow built on top of it is working as hard as it should be.